Basic concepts to keep in mind for external fluid dynamic analysis results:
Effective post-processing techniques are crucial for interpreting external CFD analysis results. Key quantities to visualize include Pressure and Wall Shear Stress, as they directly influence drag resistance. A careful examination of these fields is essential for accurately post-processing CFD results.
Pressure and Wall shear stress:
While pressure is the force acting perpendicular to the surface, wall shear stress is the force exerted by the air as it slides across the surface, parallel to it.

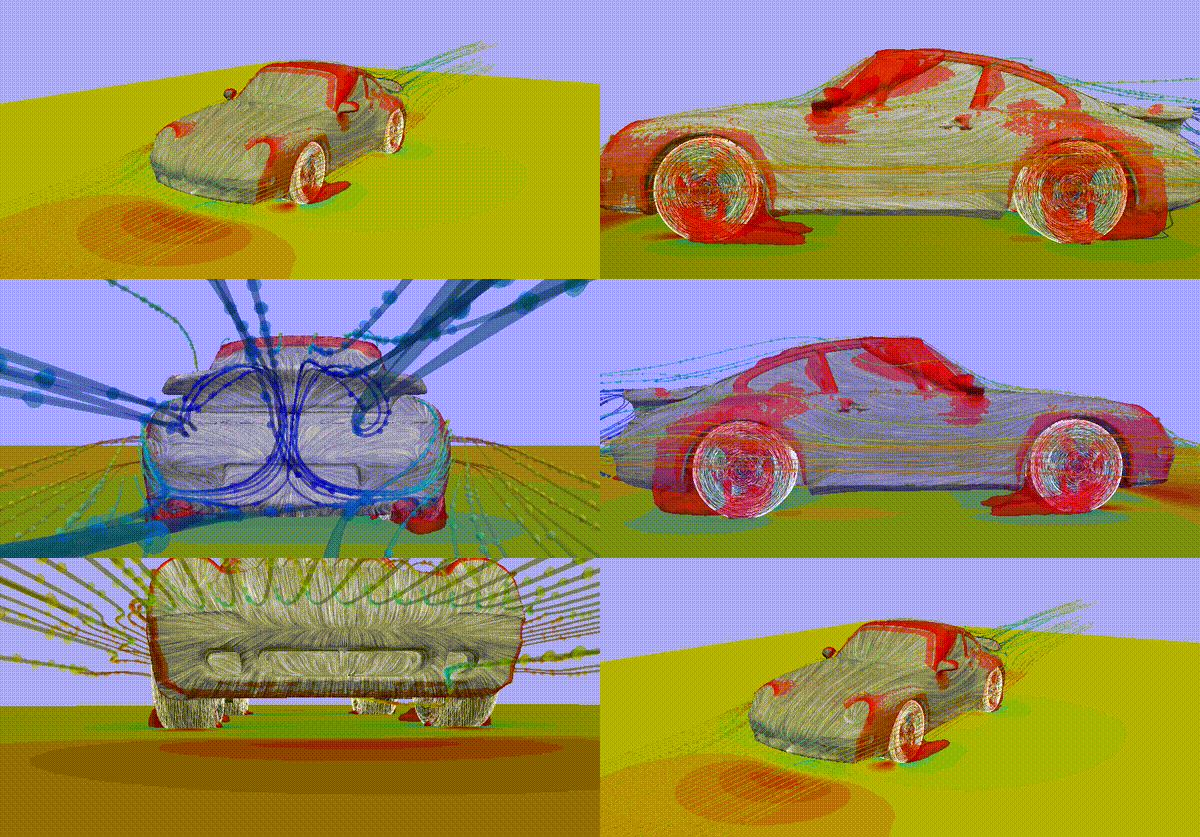
The following images contain some details:
-
regarding the separation on the wheels, you can observe the effect of the flow behind them. There is separation at the rear, resulting in low friction,
-
you can see the effect of the mirror, which influences the flow around the car's body,
-
there is stagnation at the front, which indicates low surface friction.

Drag
Drag, or air resistance, is the force exerted by the wind on an object in the direction of the airflow. It consists of pressure drag (acting perpendicular to the surface) and friction drag (slinding over the surface). In most cases, pressure drag is dominant.
The drag coefficient is a dimensionless quantity that represents the aerodynamic resistance of an object moving through a fluid. It is defined as follows:

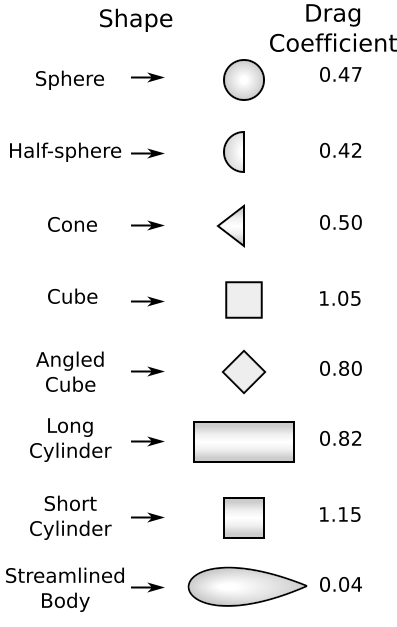
The image below illustrates typical CD values (from NASA and Wikipedia). More streamlined objects will have a low CD, while less streamlined objects will have a high CD.

The CD provides a measure of the aerodynamic efficiency of an object. By approximation, the actual drag force FD on the object, as well as the power P required to propel it, vary as a function of the wind speed according the following formulas:

3D Pressure Clouds
Underpressure zones are areas where the pressure is lower than that of the surrounding air. These zones are often caused by abrupt changes in shape, especially those resulting from sudden changes in cross-sectional or surface geometry. Smoothing these areas can help reduce drag.
The following images provide insight into which features of your object are causing drag by displaying 'clouds' of low pressure.
The red clouds here indicate the sources of drag, and technically, this is an iso-surface for the total pressure coefficient with a value of 0. Anything inside this volume represents a low-pressure bubble that causes drag, generating resistance and slowing your car down.

If you are interested, there are many tutorials available on CFD tutorials page.
Back to Homepage Back to FEM/FEA Consultancy Back to FEM/FEA Tutorials Back to FoamBuilder Back to Software Development Services Back to Software Development Services foamBuilder Back to Software Development Services DAKOTA interface Back to Software Development Services Post-processing Back to FEM/FEA Courses Back to Who we are Back to Contact Back to Request Back to open resource Back to News